Day 3: Importing Data and Statistical Plots
Today we will learn to import data from external files and plot them.
1. Loading data from files
To load the data from external text or CSV file we have to use loadtxt function from the numpy library. This function will store the column into the lists in python, which can be further processed in the program.
1.1 Single Column File
A single comma separated row file can be read as the following. Let primes.txt stores the data consist of first 100 prime numbers separated by comma looks as the following
2, 3, 5, 7, 11, 13, 17, 19, 23, 29, 31, 37, 41, 43, 47, 53, 59, 61, 67, 71, 73, 79, 83, 89, 97, 101, 103, 107, 109, 113, 127, 131, 137, 139, 149, 151, 157, 163, 167, 173, 179, 181, 191, 193, 197, 199, 211, 223, 227, 229, 233, 239, 241, 251, 257, 263, 269, 271, 277, 281, 283, 293, 307, 311, 313, 317, 331, 337, 347, 349, 353, 359, 367, 373, 379, 383, 389, 397, 401, 409, 419, 421, 431, 433, 439, 443, 449, 457, 461, 463, 467, 479, 487, 491, 499, 503, 509, 521, 523, 541
To read this data and store all the values in a list named primes we use the following command, observe that data is separated by ,.
import numpy as np

# loading primes in list, delimiter is used to separate data
primes = np.loadtxt("primes.txt", delimiter=',')
print(primes)
[  2.   3.   5.   7.  11.  13.  17.  19.  23.  29.  31.  37.  41.  43.
  47.  53.  59.  61.  67.  71.  73.  79.  83.  89.  97. 101. 103. 107.
 109. 113. 127. 131. 137. 139. 149. 151. 157. 163. 167. 173. 179. 181.
 191. 193. 197. 199. 211. 223. 227. 229. 233. 239. 241. 251. 257. 263.
 269. 271. 277. 281. 283. 293. 307. 311. 313. 317. 331. 337. 347. 349.
 353. 359. 367. 373. 379. 383. 389. 397. 401. 409. 419. 421. 431. 433.
 439. 443. 449. 457. 461. 463. 467. 479. 487. 491. 499. 503. 509. 521.
 523. 541.]
Alert
The data file primes.txt should be saved in the same folder where the python program is saved. Otherwise you have to provide the full path of the primes.txt. For example if you have downloaded this file in the android mobile then the path will be
primes = np.loadtxt("/storage/emulated/0/Download/primes.txt", delimiter=", ")
In general you can obtain the path from the details or properties of the stored file.
Warning
The loadtxt function get only the data that can be converted into numbers. To get the data in other types we have to pass the type of data as an optional argument. For example to get data in strings we may use
age_group = np.loadtxt("fruits.txt",dtype=np.str)
Ex: Download the primes-exercise.txt and try to print the data as above.
Ex: Download the statesandut.txt file containing the name of states and union terrotories of India and try to make list of this.
1.2 Multi Columns File
Suppose we want to load a marks.csv that consist of two columns with a header as follows
Roll No.,Marks
1,21
2,30
3,22
4,21
5,20
6,23
7,23
8,22
9,22
 .
 .
 .
To read each column as a separate list and skipping the first row, we can use the following,
import numpy as np

# we pass the skiprow=1 to skip the first row
roll_no, marks = np.loadtxt("marks.csv", delimiter=',', skiprows=1, unpack=True)
print(roll_no, marks)
[ 1.  2.  3.  4.  5.  6.  7.  8.  9. 10. 11. 12. 13. 14. 15. 16. 17. 18.
 19. 20. 21. 22. 23. 24. 25. 26. 27. 28. 29. 30. 31. 32. 33. 34. 35. 36.
 37. 38. 39. 40. 41. 42. 43. 44. 45. 46. 47. 48. 49. 50. 51. 52. 53. 54.
 55. 56. 57. 58. 59. 60. 61. 62. 63. 64. 65. 66. 67. 68. 69. 70. 71. 72.
 73. 74. 75. 76. 77. 78. 79. 80. 81.]
[21. 30. 22. 21. 20. 23. 23. 22. 22. 25. 21. 23. 21. 23. 24. 22. 21. 23.
 23. 21. 28. 30. 29. 27. 25. 23. 25. 23. 29. 22. 21. 26. 30. 22. 22. 20.
 23. 23. 23. 30. 21. 22. 30. 28. 28. 24. 21. 24. 25. 23. 24. 24. 26. 23.
 25. 24. 28. 23. 25. 20. 22. 29. 26. 25. 24. 24. 30. 30. 24. 25. 29. 28.
 30. 25. 27. 30. 24. 30. 28. 24. 30.]
Tip
To skip any number of rows from the top we pass the skiprows as an optional arguments. For example to skip top two rows of the data we can use
roll_no, marks = np.loadtxt("marks.csv", delimiter=',', skiprows=2, unpack=True)
To get a particular column we can pass the optional argument userow as follows
marks = np.loadtxt("marks.csv", delimiter=',', usecols=(1), useunpack=True)
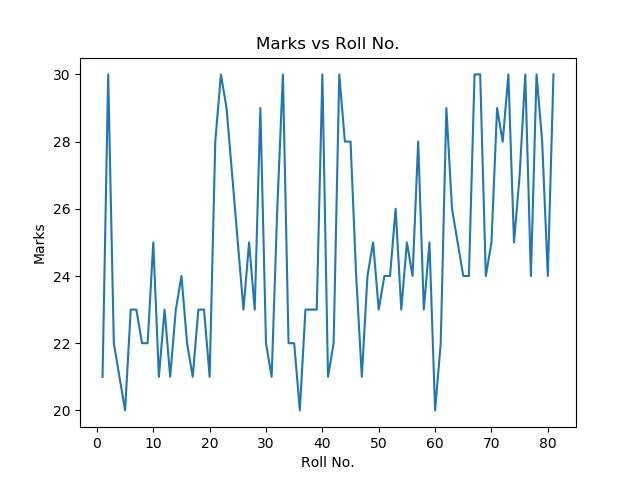
1.3 Plotting data
Now we have imported the data from files as lists in python. Now we can plot using plot command, for example, the data from above files can be plotted using the following code
import numpy as np
import matplotlib.pyplot as plt

roll_no, marks = np.loadtxt("marks.csv", delimiter=',', skiprows=1, unpack=True)

plt.plot(roll_no, marks)
plt.xlabel("Roll No.")
plt.ylabel("Marks")
plt.title("Marks vs Roll No.")
plt.show()
Tip
We can also apply some functions on any list and then plot them.
2. Other type of Plots
The default plot join all the points to make a plot which is not relevant all the time. For example joining all the points in the above graph doesn't make it relevant. Here we will see the examples of more types of plot in python.
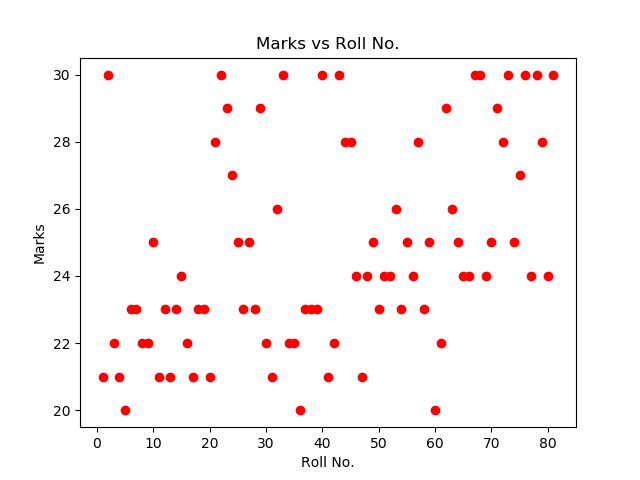
2.1 Scatter plot
In a scatter plot the data is displayed as a collection of points, each point determines the position on and axes. To make a scatter plot scatter function is used from the matplotlib.pyplot library.
import numpy as np
import matplotlib.pyplot as plt

roll_no, marks = np.loadtxt("marks.csv", delimiter=',', skiprows=1, unpack=True)

plt.scatter(roll_no, marks, color='red')
plt.xlabel("Roll No.")
plt.ylabel("Marks")
plt.title("Marks vs Roll No.")
plt.show()
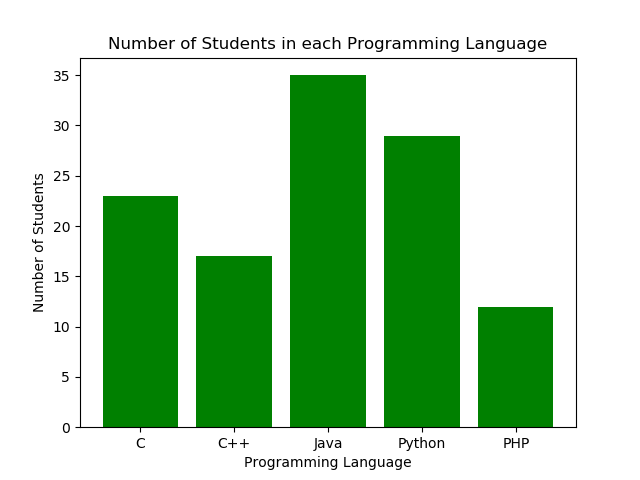
2.2 Bar Graph
A bar graph is in the python is plotted using the bar function in matplotlib.pyplot library.
A simple example of bar graph is the following
import numpy as np
import matplotlib.pyplot as plt

langs = ['C', 'C++', 'Java', 'Python', 'PHP']
students = [23,17,35,29,12]

plt.bar(langs, students)
plt.xlabel("Programming Language")
plt.ylabel("Number of Students")
plt.title("Number of Students in each Programming Language")
plt.show()
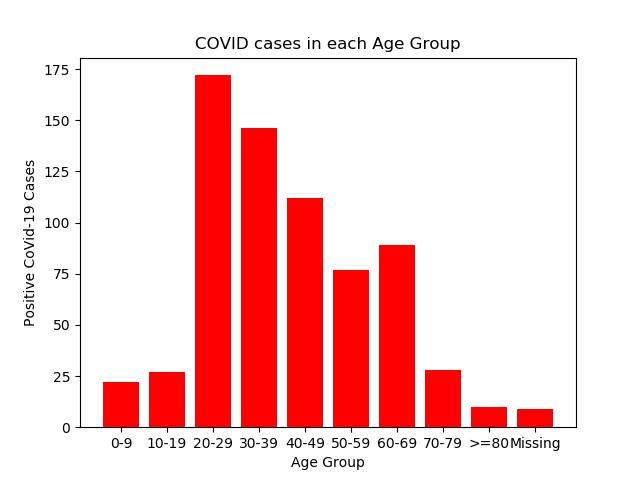
A data on csv contains the number of COVID-19 cases according to age groups. Each age groups consist of 10 years. The head of the data looks like this
Sno,AgeGroup,TotalCases,Percentage
1,0-9,22,3.18%
2,10-19,27,3.90%
3,20-29,172,24.86%
4,30-39,146,21.10%
5,40-49,112,16.18%
6,50-59,77,11.13%
7,60-69,89,12.86%
8,70-79,28,4.05%
9,>=80,10,1.45%
We can use 1st and 3rd column of the data to plot the following bar graph.
import numpy as np
import matplotlib.pyplot as plt

# getting the data in lists
age_group = np.loadtxt("agegroupcovid.csv", delimiter=',', skiprows=1, usecols=(1), unpack=True, dtype=np.str)
positive = np.loadtxt("agegroupcovid.csv", delimiter=',', skiprows=1, usecols=(2), unpack=True)


# plotting the bar graph
plt.bar(age_group, positive, color='red')

# adding attributes to the graph
plt.xlabel("Age Group")
plt.ylabel("Positive CoVid-19 Cases")
plt.title("COVID cases in each Age Group")

# showing the graph
plt.show()
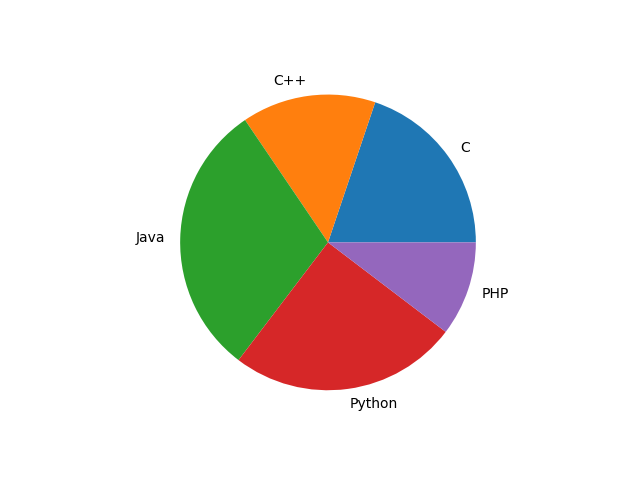
2.3 Pie Chart
A pie chart is a circular chart divided into sectors,to illustrate numerical proportion. Pie chart is plotted using pie function from matplotlib.pyplot library.
A simple pie chart can be plotted as
import numpy as np
import matplotlib.pyplot as plt

langs = ['C', 'C++', 'Java', 'Python', 'PHP']
students = [23,17,35,29,12]

plt.pie(students, labels = langs)
plt.show()
The COVID-19 example can also be represented in pie chart using the following code.
import numpy as np
import matplotlib.pyplot as plt

age_group = np.loadtxt("agegroupcovid.csv", delimiter=',', skiprows=1, usecols=(1), unpack=True, dtype=np.str)
positive = np.loadtxt("agegroupcovid.csv", delimiter=',', skiprows=1, usecols=(2), unpack=True)

plt.pie(positive, labels=age_group)
plt.title("COVID cases in each Age Group")

plt.show()

Ex: Make a plot of each type using any data of your choice.