Day 2: Using Libraries and Plotting Functions
The agenda of today is to import some external libraries and plot mathematical functions.
1. Importing Libraries
To increase the functionality of any language we use libraries or pre written code.
A very useful library in python is called numpy which is used to do numerical calculation in python. In order to import a library in python you can use any of the following methods.
import numpy # method 1
import numpy as np # method 2
from numpy import * # method 3
Any library has some function or variable included in them. for example numpy library has mathematical sine function as sin and the variable pi. For each method these things can be accessed as follows
Method 1: In order to import the function and variable we will do the following
import numpy
print(numpy.pi) # prints the value of pi
print(numpy.sin(numpy.pi)) # prints the sin(pi)
Method 2: In order to import the function and variable we will do the following
import numpy as np
print(np.pi) # prints the value of pi
print(np.sin(np.pi)) # prints the sin(pi)
Method 3: In order to import the function and variable we will do the following
from numpy import *
print(pi) # prints the value of pi
print(sin(pi)) # prints the sin(pi)
Tip
Each method has its own advantages and disadvantages but for this course we will use the second method only.
2. Plotting simple function in python
To plot simple functions in python we use numpy and matplotlib libraries and three important functions.
-
linspacefromnumpyThe functionlinspaceis used to generate a number of equidistant points on a line inteval. It takes three arguments.linspace(x,y,n)will generate a list of n points between x and y.Ex: Create 100 equally spaced points between and
-
plotfrommatplotlib.pyplotThis is the function used to make a plot. It requires two argument.plot(x,y)will plot list of elements x versus y -
showfrommatplotlib.pyplotThis function will show the final plot. It is simply invoked by typingshow()
2.1 Simple Plots
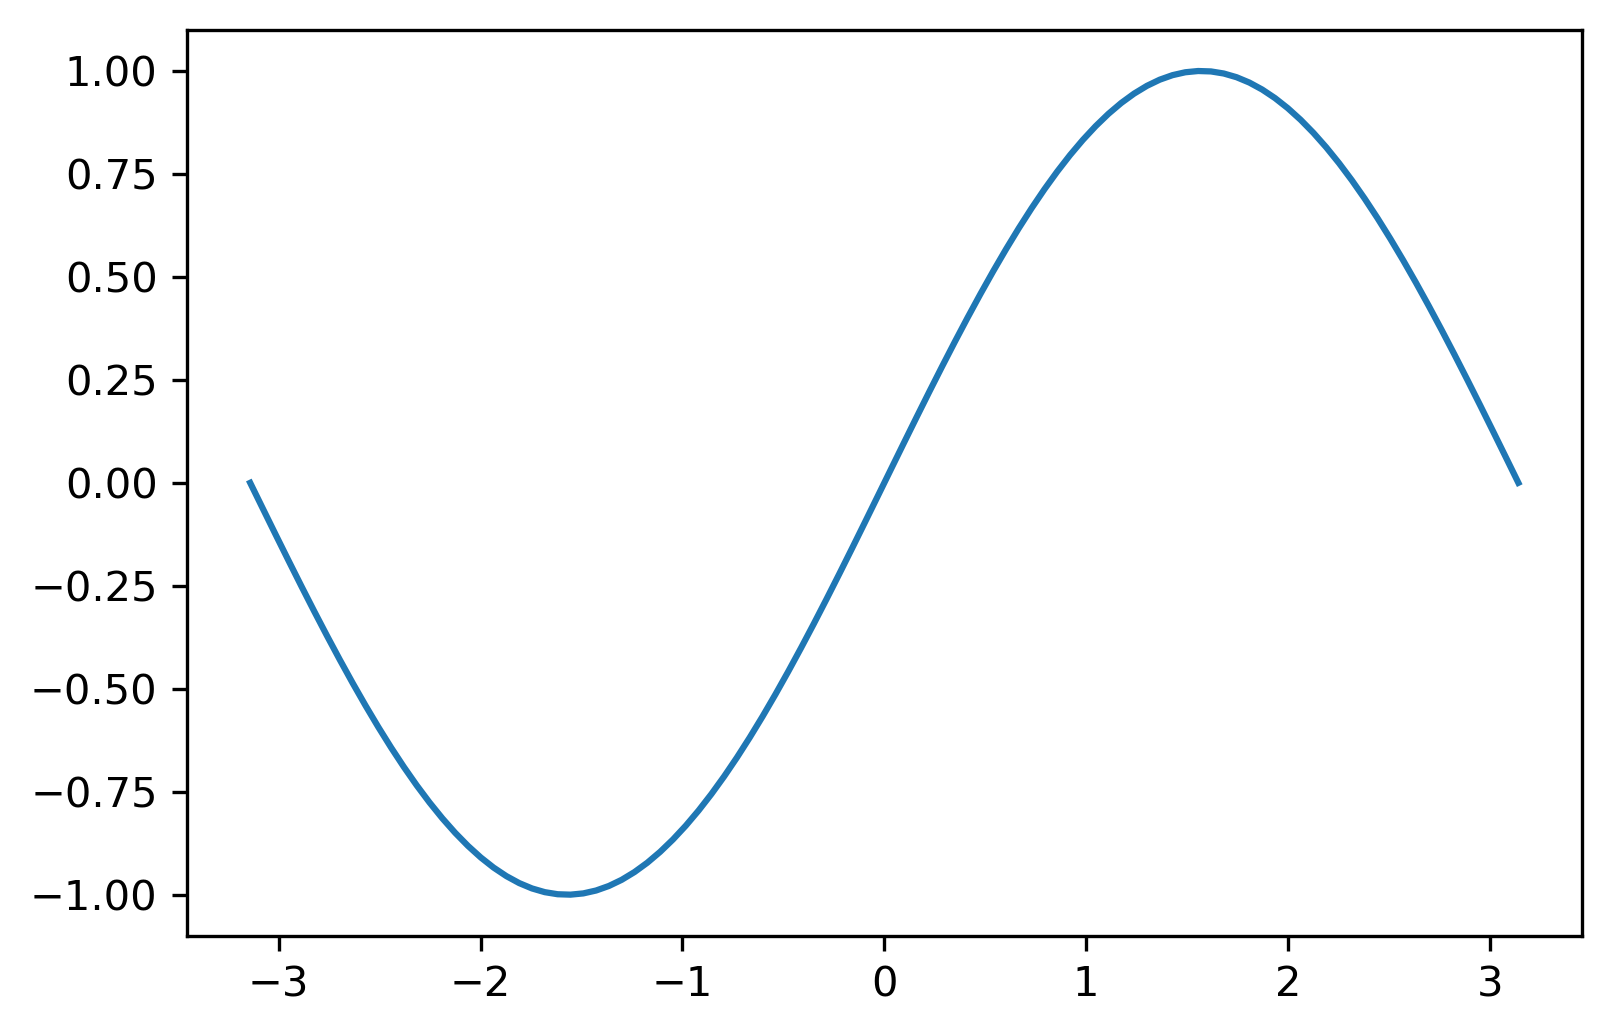
Now we have understood the basic components used to plot a function in python. Now we will see them together in a simple example by plotting the function between to .
# 1. import necessary libraries
import numpy as np
import matplotlib.pyplot as plt
# 2. generate a list of points in the given domain
x = np.linspace(-np.pi, np.pi, 100)
# 3. apply the function on x
y = np.sin(x)
# 4. plot the y versus x
plt.plot(x,y)
# 5. show the plot
plt.show()
Ex: Plot the following function in the interval
2.2 Adding Attributes in Plots
The graph shows visual information in a small space in the form of an image. The representation can be improved by adding extra information like title legends and other things. These are called attributes.
-
Modify the attributes of a plot like color, line width, line style by passing additional arguments.
plt.plot(x, y, color='blue')this will make the graph blue -
Add title to a plot using title command.
plt.title('Derivative Graph')this will make a title of the graph -
Incorporate LaTeX style formatting by adding a $ sign before and after the string.
plt.plot(x,f(x),label='$f(x)=tan(x^2)$') -
Label x and y axes using xlabel() and ylabel() commands.
plt.xlabel('x values') plt.ylabel('y values') -
Add annotations to a plot using annotate() command.
-
Get and set the limits of axes using xlim() and ylim() commands.
Tip
Try to add one attribute at a time. Use plane english in double/single quotes.
Example using all these attributes together:
import numpy as np
import matplotlib.pyplot as plt
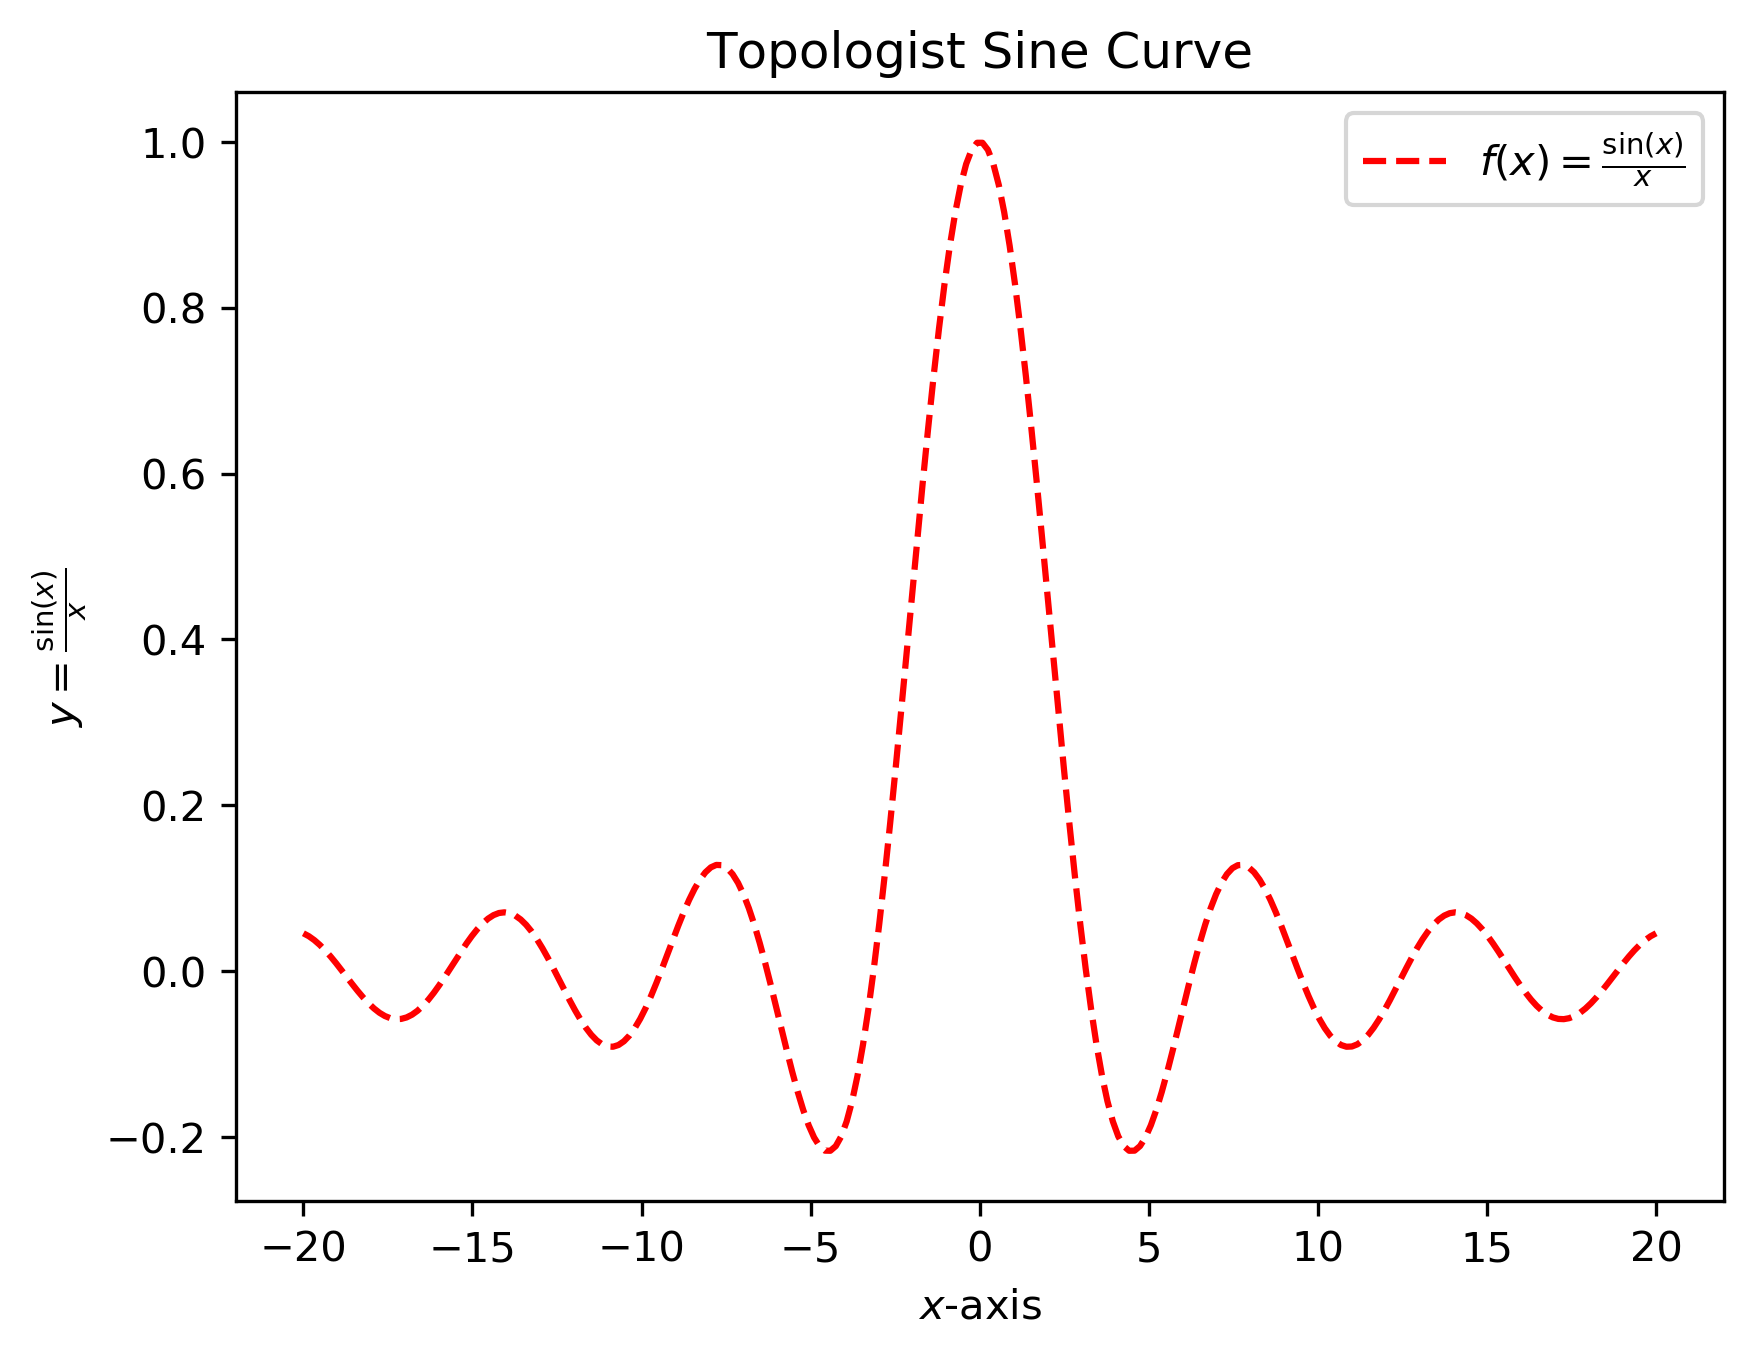
x = np.linspace(-20, 20., 250)
y = np.sin(x) / x
plt.plot(x, y, color='red', linestyle='dashed')
plt.xlabel("$x$-axis")
plt.ylabel(r"$y = \frac{\sin(x)}{x}$")
plt.legend([r"$f(x)=\frac{\sin(x)}{x}$"])
plt.title(r"Topologist Sine Curve")
plt.show()
Ex: Draw a plot of cosine graph between to with line thickness in blue colour.
2.3 Saving Plots
In order to save the plot in the local directory we use savefig function. The plot can be saved in the following format.
- ps
- png
- svg
- eps
To save the figure in current working directory use the code.
plt.savefig("myplot.png")
To save the plot of topologist sine curve I have used the following
plt.savefig('/Users/ssuman/Downloads/topologist-sine.png', dpi=300, bbox_inches='tight')
3. More Things to Explore
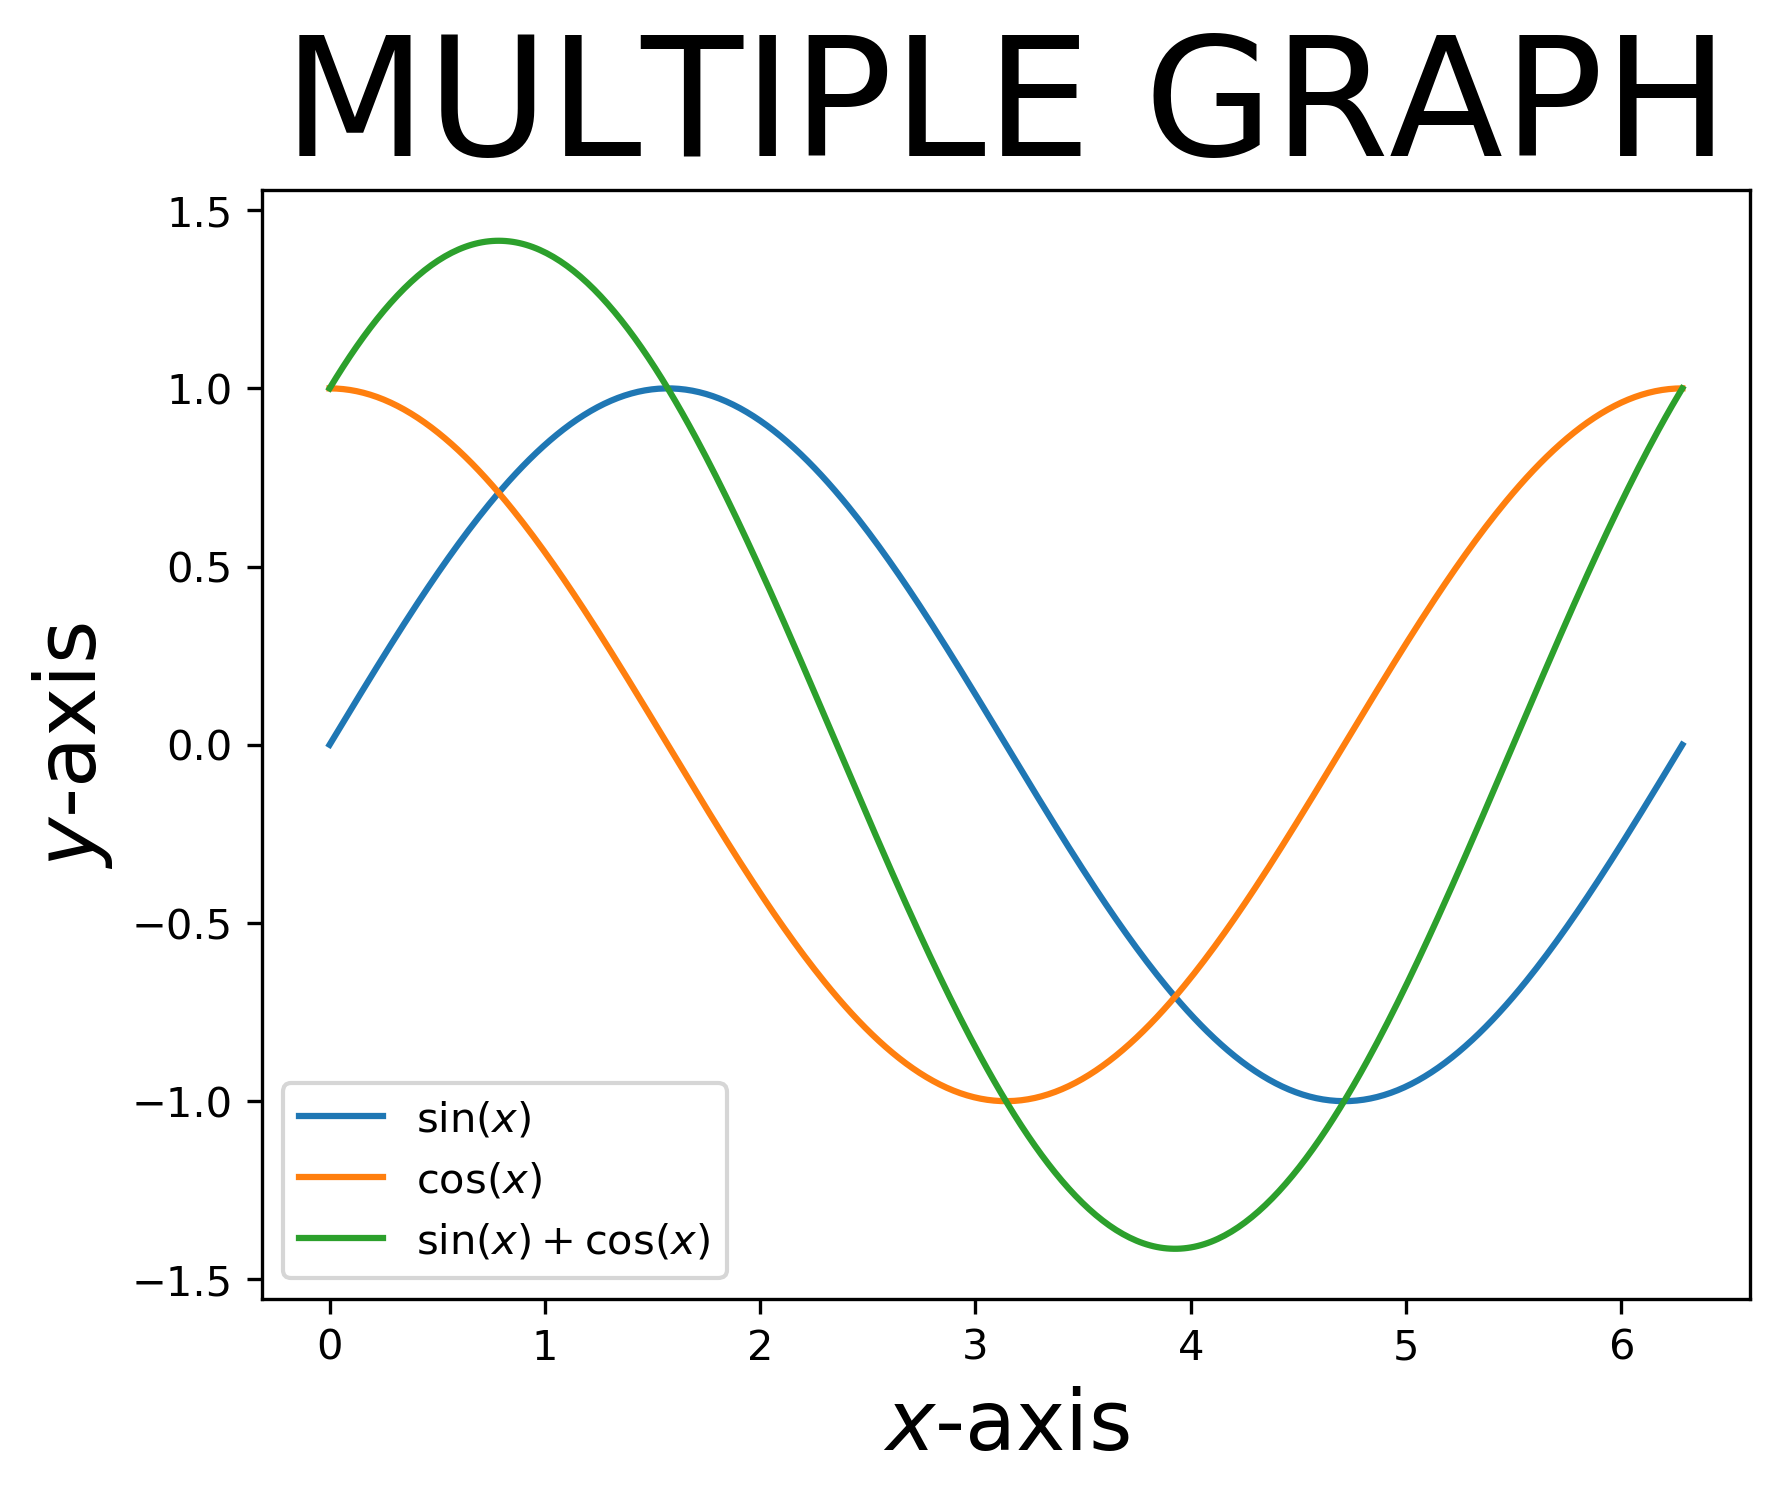
- Multiple plots
We can plot more than one graphs together as follows
import numpy as np
import matplotlib.pyplot  as plt

x=np.linspace(0,2*np.pi,400)
a=np.sin(x)
b=np.cos(x)
c=a+b

# plot all the graphs together and labels can
# be used to identify them
plt.plot(x,a, label='sin(x)' )
plt.plot(x,b, label='cos(x)')
plt.plot(x,c, label='sin(x)+cos(x)')

# adding attributes to the plot
plt.xlabel('x-axis', fontsize=20)
plt.ylabel('y-axis', fontsize=20)
plt.title('MULTIPLE GRAPH' ,fontsize=40)
plt.legend()

# save and display the graph
plt.savefig('multiplegraph.png')
plt.show()
-
Subplots
Subplot is used to plot more than one plots in a bigger plot.